
Tuesday, November 14, 2017
Supervised Image Classification
This week we worked on Lab 10 which allowed us to create spectral signatures and AOI features. We were able to produce classified images from satellite data given. We were able to recognize and eliminate spectral confusion between spectral signatures. The map shown is a Land Use map of Germantown Maryland. The different color indicate different land uses, we had to create the SIG file from an Image file in order to be able to classify the different land uses.

Tuesday, November 7, 2017
Unsupervised Classification Lab9
This week we worked in ERDAS to label features in an image under categories. We were able to take the image of the UWF campus and classify it.
The map below is a map that shows the UWF campus. The colors in the legend signify the different land features of the image.
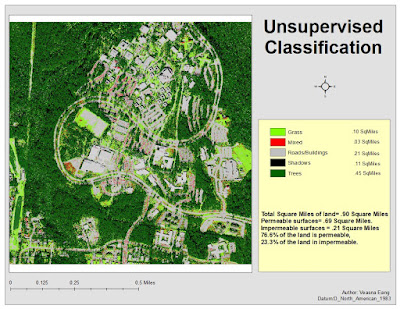
The map below is a map that shows the UWF campus. The colors in the legend signify the different land features of the image.
Wednesday, November 1, 2017
Thermal & Multispectral Analysis, Lab8 4035
This week we got to toy with Composite bands in Arcmap, and Layers Stacks in ERDAS. In my map I chose to show the fires in Florida. I chose this image for the fires would show better thermally in comparison to the land, for me to get the image to where I wanted it, I stretched the image and chose band 6, then I color ramped the image from red to blue, then I adjusted the DN value in the Histograms, to 14 and 40. The blue color in the image shows the cooler objects, and the yellow and red images are the objects that are thermally hotter.


Subscribe to:
Posts (Atom)